


2016 Novelist Income Results, Part 5: Miscellaneous Data
Introduction
This is the fifth and final chunk of data and analysis from the 2016 Novelist Income Survey.
This is where I look at all the other random and miscellaneous data points that either didn’t fit elsewhere, or else I couldn’t figure out quite what to do with them. After this, I’ll be pulling everything together into a single downloadable report for folks.
Who Lost Money in 2016?
One thing I found interesting — of the 371 people who provided gross income and expenses data, 63 ended up with a net loss in 2016. In other words, roughly one out of six published novelists lost money last year.
17 of these identified as full-time writers, with the other 46 being part-time. Looking at the overall number of full- and part-time respondents, the part-time authors were disproportionately more likely to end up in the red.
How did those 63 authors break down in terms of indie/small press/large press?
- Indie: 36
- Small: 19
- Large: 8
Comparing those numbers to the overall breakdown of indie/small/large press gives us the following graph:
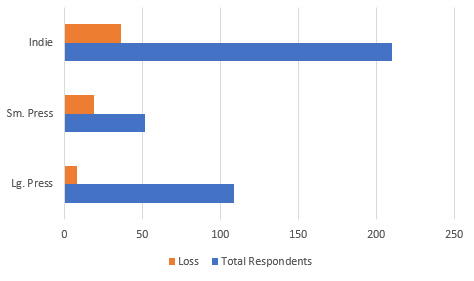
We can also look at the percentage of novelists who lost money in each category, which is perhaps a little more illuminating.
- Indie: 17%
- Small: 37%
- Large: 7%
As always, be careful about drawing too many conclusions from this.
Genre Breakdown
I messed up on this part. I asked people what genre(s) they published in during 2016, and let people check as many boxes as they liked, with an additional field for “Other.” This meant I got pretty accurate data, but a lot of folks selected multiple genres, which made it harder for me to do much with the data. In the future, I think I need to ask people to choose their primary genre instead.
Looking at which genres were chosen, we can see that the data are slanted toward SF/F and Romance.
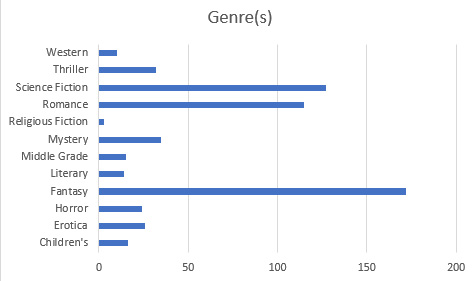
As a SF/F person myself, it makes sense that my outreach on the survey would bring in a lot of my fellow SF/F authors. Basically, what this means is that the results and conclusions may not apply as strongly to, say, religious fiction as they do to fantasy or romance.
When Did You Publish Your First Book?
What happens when you plot net income against the year the author published their first book?
I removed one outlier — an author who made close to five million, and whose first book came out near the middle of the range. The results were not what I expected.
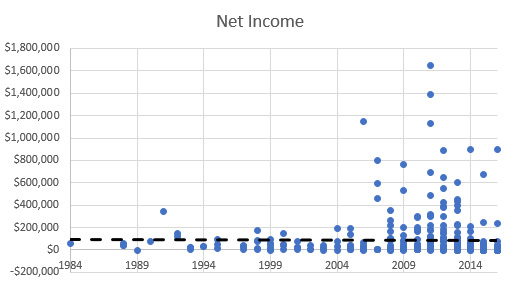
That trendline is pretty much horizontal, suggesting little to no relation between how long you’ve been publishing and how much money you make. Running the correlation function in Excel gave a correlation of 0.01.
I can see several ways of thinking about this. One is that you can spend 30 years writing books, and it doesn’t mean you’re more likely to be financially successful. Which is depressing as hell. But maybe it just means financial success can come at any time. Or maybe writers who broke in a long time ago aren’t as prolific these days, which is why their income was comparable to newer authors who might be more active?
I honestly don’t know, and I suspect you’d need a lot more analysis — and probably a lot more data — to draw any firm conclusions here.
Almost Finished
That’s pretty much everything I can do with the data. All that’s left now is for me to pull it all together into a single report. I’ll be incorporating some of the feedback and suggestions from the comments as well, thank you. I’ll also be anonymizing the data and sharing that for folks to play with.
I hope this has been helpful and illuminating for folks!
2016 Novelist Income Survey Results, Part 1
February 26, 2017 @ 1:31 pm
[…] Part 5: Miscellaneous Data […]
Brad Beaulieu
February 26, 2017 @ 1:34 pm
I’d be very curious to see the breakdown of average yearly income broken down by genre. We always hear that Romance vastly outsells Specfic, that Fantasy outsells Sci-Fi, and so on. Those are publishing realities, but I wonder how it breaks down *per author*. Romance sells well, but does it have enough additional authors writing it that the income per author evens out to be about the same? Or is it significantly greater? Ditto for Fantasy vs. Sci-Fi vs. erotica, etc.
Jim C. Hines
February 26, 2017 @ 1:41 pm
Brad Beaulieu – Me too. But with so many authors reporting multiple genres, I don’t know how I could have teased that out with this year’s data set.
Maybe next year 🙂
Brad Beaulieu
February 26, 2017 @ 1:42 pm
Ah, of course. You could only really do that for those who reported a single genre, which would shrink the sample size and weaken the results.
Fred Smith
February 26, 2017 @ 1:49 pm
Thank you so much for doing this- it’s enormously informative. By any chance, are there links to previous years’ surveys?
Harry Connolly
February 26, 2017 @ 1:51 pm
I’m curious about the same question Brad is.
Harry Connolly
February 26, 2017 @ 1:52 pm
Doh! I should have refreshed the page before commenting. Sorry about that.
Jim C. Hines
February 26, 2017 @ 1:54 pm
Fred Smith – This is the first year I’ve done it. But I’m hoping to gather up some links to surveys and research other folks have done when I pull everything together.
In the past, I blogged about my individual writing income. You can see the most recent one of those, with links, at http://www.jimchines.com/2016/01/2015-writing-income/
Doug Engstrom
February 26, 2017 @ 2:40 pm
Thanks for doing this! It’s so helpful to see a realistic picture.
Tara
February 26, 2017 @ 4:59 pm
Some interesting final results! Be interesting to see what the breakdown is of small/big/indie across genres, but when authors are writing across several genres, that wouldn’t be doable. I wonder if writing across several genres is more profitable? I suspect that it’s mostly indies who write across multiple genres while authors with large publishers stick to one genre, but I could be totally off-base.
Speaking of genres, funny that you got so many results from romance writers! I wouldn’t have expected that. Or maybe lots of romance authors also write sci-fi on the sly, who knows.
Fred Smith
February 26, 2017 @ 7:30 pm
Jim Hines- thank you!
Jim C. Hines
February 27, 2017 @ 12:52 pm
Tara – yeah, I think the genre analysis will have to wait until next year, if I do this again.
Alexander Claxton
March 1, 2017 @ 12:02 pm
The graph for year first published is quite negatively skewed which is likely distorting your correlation. Also it may be that the pattern is non-linear, which prevents the standard correlation equation from accurately measuring the relationship observed.
I’m interested to get a hand on this data and dig into it…
The Noble Pen for March 30, 2017 | The Noble Pen
March 24, 2017 @ 10:10 am
[…] C. Hines (blog) has added to his series of posts on author income, and collected the series into one pdf […]